Platform Teams Cut On-Call by Measuring Internal Tool Dead Code
Every platform team builds glue code. A CLI wrapper here, a migration script there, a dashboard widget that once served a purpose. Over months, these small additions accumulate into a sprawling codebase that nobody fully understands. The cost is invisible until the pager goes off at 3 AM for an error in a module that no active tool depends on. Dead code is not just clutter—it is a direct contributor to on-call fatigue.
Platform teams at companies like Spotify, Netflix, and Uber have started treating internal tool dead code as a measurable liability. By applying static analysis and runtime tracing, they identify unused endpoints, orphaned functions, and deprecated integrations. The payoff is not theoretical: fewer code paths mean fewer alarms, simpler debugging, and faster incident response. This article lays out how to measure dead code, tie cleanup to on-call reduction, and sustain a culture of pruning.
The Unspoken Tax of Internal Tools
Platform teams exist to accelerate other developers. They build CI/CD pipelines, deployment dashboards, service catalogs, and internal SDKs. The implicit promise is that these tools reduce cognitive load for the rest of the organization. But the platform team itself carries a growing cognitive load from maintaining its own creations.
Every internal tool starts with a clear purpose. A year later, that purpose may have shifted. A migration script written for a database upgrade stays in the repo even after the migration completes. A service discovery client gets replaced by a newer version, but the old module lingers. The team that built it has moved on. No one is sure whether deleting it will break something downstream.
This accumulation is not malicious—it is the natural result of velocity. Engineers ship features, fix bugs, and move to the next priority. Cleaning up is rarely rewarded. The result is a codebase where unused code can account for 20 to 30 percent of the total, according to internal audits shared at engineering conferences. Spotify's Backstage team, for example, documented that unused plugin code in their internal developer portal contributed to confusing error messages and longer debug cycles.
The tax shows up in on-call rotations. When an alert fires, the engineer must trace through multiple layers of tooling. Dead code creates false positives—alarms from deprecated endpoints that no longer serve real traffic. It also increases mean time to resolution (MTTR) because the investigator wastes time ruling out irrelevant code paths. Over a quarter, those minutes add up to hours of lost productivity and frayed nerves.
Why Dead Code Survives in Platform Repos
Dead code persists for several reasons, and understanding them is the first step to removal. The most common is fear. Platform tools often have unknown dependencies. A shared library might be imported by a dozen services, and no one has a complete map of who uses what. Deleting a function that seems unused could break a deployment pipeline that runs once a quarter.
Another factor is ownership. In a monorepo, modules can become orphaned when their original authors leave the team or the company. No one feels responsible for a piece of code that they did not write and do not understand. The code sits in a gray zone—too risky to delete, too obscure to maintain. Over time, it becomes a source of subtle bugs and confusing documentation.
Legacy migrations also leave behind dead code. When a platform team moves from one infrastructure provider to another, they often write adapters or shims. Once the migration is complete, the old code remains. The team is busy with the next initiative, and the shim is left as a safety net. But safety nets that are never used become trip hazards. A 2022 study by Microsoft Research found that roughly 30 percent of endpoints in large-scale internal APIs were never called in production over a six-month period.
Copy-paste culture in monorepos accelerates the problem. Engineers duplicate code snippets from existing modules rather than abstracting shared logic. Each copy introduces slight variations, and over time the original and the copy diverge. When the original is updated, the copies are not. The result is a forest of near-identical functions, only a few of which are actually invoked. Without systematic measurement, the team cannot distinguish the living from the dead.
Measuring Dead Code with Call-Graph Analysis
The antidote to guesswork is measurement. Two complementary approaches dominate: static analysis and runtime tracing. Static analysis builds a call graph by scanning the codebase for import statements, function calls, and export declarations. Tools like depcheck, Madge, or custom scripts can flag modules that are never imported or functions that are never called.
For platform SDKs and internal libraries, static analysis works well because the code is self-contained. A function that is not called anywhere in the repo is likely dead. However, static analysis has blind spots. Dynamic imports, reflection, and runtime code generation can hide dependencies. That is where runtime tracing comes in.
Runtime tracing instruments the application to record which code paths execute under real traffic. For internal tools, staging environments that mirror production traffic are ideal. Teams can use OpenTelemetry to capture spans for every function call or API endpoint. After a week of observation, they compare the trace data against the full set of available code paths. Any path that never appears in traces is a candidate for removal.
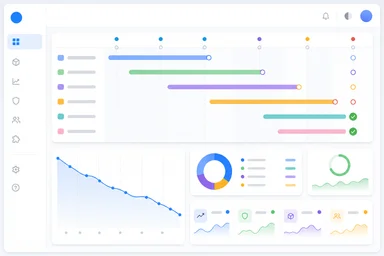
Netflix's Vizceral project visualized service dependencies in real time, but the same principle applies at the function level. A coverage report from runtime tracing can be generated as a JSON artifact and posted to a dashboard. GitHub Actions can be configured to run a nightly job that flags unused imports and posts a PR comment. The key is making the data visible and actionable. Without a dashboard, the measurements sit on a hard drive and the dead code persists.
Tying Cleanup Directly to On-Call Reduction
Once dead code is measured, the next step is connecting cleanup to on-call metrics. The hypothesis is simple: fewer code paths mean fewer possible failure modes. Each removed module eliminates a surface area for bugs, misconfigurations, and dependency conflicts. Over time, this should reduce the number of alerts and lower MTTR.
PagerDuty incident data can be correlated with code size. A platform team at a mid-size e-commerce company tracked their top ten alert sources over six months. They found that four of the ten originated from modules that had not been touched in over a year. After deprecating those modules, the corresponding alerts disappeared. The team's on-call rotation went from one major incident per week to one every three weeks.
Uber's 2019 migration from a monolithic Python service to a modular architecture provides a larger example. By removing unused code paths during the migration, the platform team estimated they saved roughly 2,000 engineer-hours in reduced debugging and rework. Each removed module contributed a small but cumulative improvement to MTTR. The team reported that incident response times dropped by minutes per event, which translated to fewer pages and less burnout.
The causal link is not always linear. Removing dead code can introduce regressions if dependencies are misidentified. But the evidence from multiple organizations suggests that the net effect is positive. The key is to measure before and after, using metrics like alert volume, MTTR, and engineer self-reported fatigue. A platform team that cannot articulate the impact of cleanup in on-call terms will struggle to justify the time investment to leadership.
Practical Playbook for Dead Code Removal
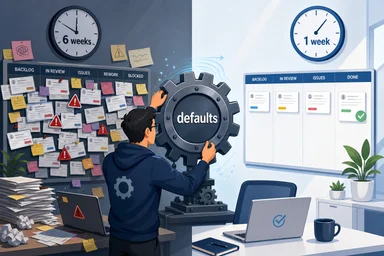
Removing dead code requires more than a script. It demands a process that balances risk with reward. A proven playbook starts with a deprecation header. Before deleting any code, add a comment or decorator that marks the module as deprecated and logs a warning when it is called. Set a deprecation window of two to four weeks. If no one reports a broken pipeline, the code is safe to remove.
Feature flags can gate old code paths. Instead of deleting a module immediately, wrap its usage in a flag that defaults to off. Monitor the flag's activation count. If it never flips to on, the code is dead. This approach is especially useful for internal APIs where consumers are other teams. The flag gives them time to migrate without a sudden breakage.
Automated PRs that delete unused code are surprisingly effective. A bot can scan the repo weekly, identify modules with zero callers, and open a PR with the deletion. The PR includes a link to the coverage report and a suggested reviewer. The reviewer's job is not to re-verify the analysis but to check for edge cases—dynamic imports or runtime registration that the tool missed. Teams that adopt this pattern report that most PRs are merged within a day.
Quarterly cleanup sprints institutionalize the habit. The platform team dedicates one week per quarter to removing dead code, updating documentation, and retiring deprecated endpoints. During the sprint, they measure the reduction in code size and the corresponding change in on-call metrics. Rewarding teams for reduction metrics—such as a 10 percent drop in unused functions—reinforces the behavior. Some organizations have created internal leaderboards that show which teams have the cleanest codebases.
Culture Shift: Treating Code as Liability
Technical processes alone are not enough. The underlying belief that code is an asset must shift to a more nuanced view: code is a liability that provides value only as long as it is used. Platform teams, in particular, must own their inventory. If a module has no known consumer, it should be treated like an unmaintained warehouse—expensive to insure and prone to attracting pests.
The 'you build it, you clean it' motto, adapted from the DevOps principle of owning what you run, applies here. When a platform team ships a new tool, they should also plan its sunset. That does not mean predicting the end date, but it does mean committing to periodic reviews. A quarterly inventory check, similar to a security audit, forces the team to justify each module's existence.
Documentation of removal rationale matters. When a module is deleted, the commit message should explain why it was unused and how the team verified that. This creates a historical record that future engineers can consult. It also builds institutional knowledge about the platform's evolution. Without documentation, the same dead code patterns may reappear.
Sharing on-call win stories internally builds momentum. When a team can say, 'We removed three unused services last quarter and our on-call incidents dropped by 40 percent,' other teams take notice. Some organizations have internal tech talks where platform engineers present before-and-after metrics. The stories are more persuasive than any mandate. Making dead code visible in dashboards—showing a live count of unused functions per repo—turns cleanup into a game that engineers want to win.
The Compound Effect of Continuous Pruning
The benefits of dead code removal compound over time. Each deletion reduces cognitive load. New engineers joining the team face a smaller codebase to learn. They can trace through the platform's logic without stumbling over irrelevant branches. Onboarding time shrinks, and the team can ship features faster.
Incident response becomes more predictable. With fewer code paths, the set of possible failure modes is smaller. Engineers can build mental models of the system that are accurate rather than aspirational. When an alert does fire, they know where to look. The reduction in ambiguity directly reduces stress and burnout.
Platform team morale improves measurably. Surveys at companies that adopted systematic dead code removal show higher satisfaction scores on questions about code quality and maintainability. Engineers report feeling more ownership over their tools. The act of cleaning up is intrinsically satisfying—a visible improvement that everyone can see.
Gartner has predicted that by 2025, organizations that actively manage tooling debt will reduce infrastructure and tooling costs by roughly 40 percent. That prediction is not just about cloud spend; it includes the human cost of maintaining unused code. Dead code is a form of technical debt that accrues interest in the form of on-call hours. The earlier a team starts pruning, the more compound interest they save.
None of this is easy. Removing code that someone else wrote can feel disrespectful. Automated tools produce false positives. A deprecation window may pass without incident, only for a quarterly batch job to fail six months later. The trade-off is real. But the alternative—letting dead code accumulate until the platform becomes unmanageable—is worse. Platform teams that measure, prune, and celebrate cleanup will find their on-call rotations quieter and their tools more trustworthy.