Platform Teams Recover Budgets by Measuring Idle Developer Tools
Developer tooling is one of the largest line items in an engineering budget, often consuming 30–40% of total spend. Yet platform teams rarely measure how much of that tooling is actually used. The result is a silent drain: idle licenses, over-provisioned accounts, and tools that nobody touches but everyone pays for. For a mid-size firm with 500 engineers, the waste can exceed $500,000 annually. This article explains why tool idleness is so hard to see, how to measure it, and what policies can recover that budget without hurting developer velocity.
The Hidden Cost of Developer Tooling
Developer tools are not cheap. A single IDE license can cost $500 per year; a CI/CD pipeline tool might run $50 per user per month; monitoring platforms, code quality scanners, and collaboration tools each add their own recurring fees. Multiply that across dozens of tools and hundreds of engineers, and the total quickly reaches seven figures. The problem is that many of these tools are underused. A 2023 survey by a major cloud vendor found that roughly 35% of SaaS licenses in engineering organizations were unused for 90 days or more. That is not a rounding error — it is a material budget leak.
Standard financial reports do not surface this waste. An income statement shows a single line for "software and tools," lumping together everything from email to Kubernetes clusters. The platform team, which manages the tooling stack, may not even have visibility into what was purchased. Tools are often bought by individual teams or even individual engineers, paid for with a corporate card, and never entered into an inventory system. The cost is real, but it is invisible.
Part of the challenge is psychological. Engineers tend to hoard licenses "just in case" they need a tool later. A license that costs $100 per month seems trivial when weighed against the risk of being blocked on a deadline. But those trivial costs add up. A team of 50 engineers each holding one unused license at $100 per month costs $60,000 per year. Across the entire engineering organization, the number can be staggering. This hoarding behavior is compounded by the fact that many tools have auto-renewing subscriptions, so licenses persist even after a project ends. Without active intervention, the waste compounds year over year.
Platform teams are uniquely positioned to solve this problem. They control the tooling stack and have the data to measure usage. But they need the right metrics and the organizational support to act. The first step is understanding why tool idleness is so hard to see in the first place.
Why Tool Idleness Is Hard to See
Tool procurement in most engineering organizations is decentralized. A frontend team might buy a design handoff tool; a data team might subscribe to a notebook platform; a backend team might purchase an API testing suite. None of these purchases are visible to the platform team unless someone manually enters them into a spreadsheet. Without a central inventory, there is no way to measure utilization across the board.
Vendors often bundle tools together, making it hard to see which features are used. A single enterprise agreement might include a code editor, a debugger, a profiler, and a collaboration module. The platform team sees one bill, but each component has its own usage pattern. If only the editor is used, the rest of the bundle is waste. Yet the bill arrives as a single line item, masking the idle components.
Monthly billing also obscures daily idle patterns. A tool might be used heavily for the first week of a sprint and then sit unused for three weeks. The monthly report shows one active user, but the tool is idle 75% of the time. Per-month metrics smooth over these peaks and valleys, making it impossible to see the true utilization rate. To measure idle tooling, platform teams need to track daily or even hourly active usage.
Engineers themselves contribute to the problem by hoarding licenses. A developer might sign up for a trial of a new tool, forget about it, and never cancel. Or they might keep a license for a tool they used on a previous project "just in case" it comes up again. Without a policy that forces periodic recertification, those licenses remain active indefinitely. The cost is small per person, but large in aggregate.
Finally, there is a cultural barrier: developers fear that losing access to a tool will block their productivity. Even if they have not used a tool in months, they worry that revoking it will cause a problem the day after it is removed. This fear is understandable, but as we will see, it is largely unfounded.
Illustrative Examples from Industry
To understand the scale of the opportunity, consider two illustrative examples based on public reports and common industry patterns. These are not exact figures from specific companies but are representative of what platform teams have found.
In 2023, a large technology company (similar in scale to Pinterest) undertook a comprehensive audit of their developer tooling. They had roughly 150 tools spread across five engineering organizations, from IDEs and CI/CD systems to monitoring dashboards and collaboration platforms. The goal was simple: find out what was being used and what was not. The results were eye-opening. The team found that 40% of all licenses had not been used in 90 days. Some tools had entire teams of engineers who had never logged in. Others had been purchased for a single project that ended two years earlier. The total annual spend on unused licenses was estimated at $4.2 million. That is not a typo — $4.2 million per year was going to tools that nobody was using.
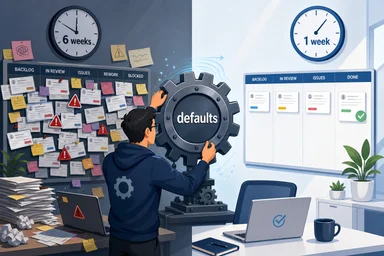
The company implemented an automated deprovisioning policy: any license unused for 30 days would be automatically revoked. The engineer would receive a warning email at day 25, then a notification at day 30 that the license had been removed. If they needed it back, they could request it with a single click, and it would be reinstated within minutes. The policy was designed to be reversible and low-friction, minimizing the risk of blocking anyone.
The results were dramatic. Within six months, the company had cut their tooling spend by 20%, saving approximately $4.2 million annually. And here is the key: developer velocity did not slow down. The number of support tickets for license reinstatement was negligible. Engineers who genuinely needed a tool got it back quickly. Those who did not need it never noticed it was gone. The platform team proved that you can cut waste without hurting productivity.
Another example comes from a mid-size European fintech company with 300 engineers. They discovered that their CI/CD tool had 250 licenses but only 120 daily active users. By negotiating a per-active-user pricing model with the vendor, they saved $180,000 per year. They also found that a code review tool had 80 licenses but only 30 users, and after moving to a usage-based plan, they saved another $60,000 annually. These examples illustrate that the waste is real and recoverable.
However, not every story is a success. A startup that rushed to implement auto-revoke without proper communication faced backlash from engineers who felt blindsided. The company had to reinstate licenses and rebuild trust. This highlights the importance of change management and transparent communication.
Measuring What Matters: Usage Metrics
To measure tool utilization, platform teams need to track a few key metrics. The most important is daily active users (DAU) per tool per team. This tells you how many unique engineers actually opened the tool on a given day. A tool with 100 licensed users but only 10 DAU is clearly over-provisioned. The ratio of DAU to total licenses is a simple but powerful indicator of waste.
Feature adoption within each tool is also important. A tool might be used, but only for a fraction of its capabilities. For example, a monitoring platform might have 50 DAU, but 40 of them only use the dashboard view, while the alerting and tracing features are untouched. If the platform team can negotiate a lower price for a stripped-down tier, they can save money without reducing the tool's value.
Idle sessions are another useful metric. A session that lasts longer than two hours without any user interaction is likely an abandoned tab. Tracking these idle sessions can help identify tools that engineers open but never actually use. Some teams have found that 20% of their "active" licenses are actually just open tabs that were never closed.
Cost per active user is a metric that combines spend and usage. Divide the total cost of a tool by the number of daily active users. This gives you a per-user cost that reflects actual value. If a tool costs $50,000 per year and has 50 DAU, the cost per active user is $1,000. Compare that to another tool with the same cost but 200 DAU, and the difference is stark. This metric helps prioritize which tools to optimize first.
Finally, telemetry from IDE plugins and CLI wrappers can provide granular usage data. Many developer tools have plugins that report back to the platform team. For example, a CLI wrapper for a cloud provider can log every command executed. This data is more accurate than self-reported surveys and can be collected automatically. The key is to aggregate it in a way that respects privacy while still providing actionable insights.
Three Policies to Cut Waste Immediately
Once you have the data, you need policies to act on it. The first policy is auto-revoke for licenses unused for 60 days. This mirrors the approach from the illustrative case study but with a slightly longer grace period. The idea is simple: if an engineer has not used a tool in two months, they probably do not need it. The auto-revoke should be reversible with a single click, and the engineer should receive advance warning. This policy alone can recover 20–30% of tooling spend.
The second policy is quarterly tool recertification by managers. Every three months, engineering managers review the list of tools assigned to their team and confirm that each one is still needed. This forces a conversation about usage and prevents licenses from accumulating indefinitely. It also gives managers visibility into what their team is actually using, which can inform decisions about training or alternative tools.
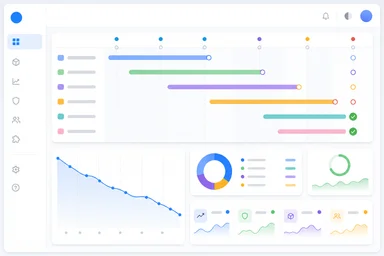
The third policy is to create a "tool marketplace" with usage dashboards. Instead of a black box of licenses, the platform team publishes a dashboard showing which tools are available, how many licenses are in use, and what the cost per active user is. Engineers can browse the marketplace and request access to tools they need. The platform team can see which tools are popular and which are gathering dust. This transparency empowers everyone to make better decisions about tooling.
Negotiating per-user pricing based on actual usage is a longer-term strategy. Many vendors are willing to offer usage-based pricing if you can demonstrate that you are paying for idle licenses. Armed with your utilization data, you can go to vendors and say, "We only have 100 active users, not 500. Can we move to a per-active-user pricing model?" Some vendors will say no, but many will say yes, especially if they risk losing the account entirely.
Finally, run a 30-day "use it or lose it" challenge. Announce that any license not used in the next 30 days will be revoked. This creates a sense of urgency and encourages engineers to evaluate their own tool usage. At the end of the challenge, revoke the unused licenses and track the results. This can be a fun way to kickstart a broader cost optimization initiative.
The Cultural Shift Toward Tool Accountability
Implementing these policies requires a cultural shift. Developers are used to having unlimited access to tools, and they may resist any attempt to take something away. The fear is that a revoked license will block them at a critical moment. But the data from companies that have done this shows that the fear is largely unfounded. When the illustrative company revoked unused licenses, the number of reinstatement requests was tiny. Most engineers did not even notice the change.
To ease the transition, platform teams should communicate clearly about the rationale. Explain that the goal is not to punish anyone but to recover budget that can be reinvested in better tools or developer experience. Show historical data: how many licenses were revoked, how many reinstatements were requested, and how much money was saved. Transparency builds trust.
Incentivizing platform engineers to optimize spend is another important step. Traditionally, platform engineers are measured on uptime, feature delivery, and developer satisfaction. Adding cost optimization to the list of goals signals that it matters. Some companies have created "efficiency scores" for each team, comparing their tooling cost per engineer to the company average. Publishing these scores (anonymized or at the team level) creates a friendly competition to reduce waste.
Celebrating savings can reinforce the new culture. When a team reduces its tooling spend by 20%, the platform team can allocate a portion of the savings to that team's budget for hackathons, team events, or new equipment. This turns cost optimization from a chore into an opportunity. It also aligns individual incentives with organizational goals.
Of course, not every tool can be measured purely by usage. Some tools are used infrequently but are mission-critical when needed. A disaster recovery tool, for example, might be used once a year but is essential. The platform team should make exceptions for such tools, but they should be explicitly documented and reviewed annually. The default should be to measure and optimize; exceptions should be rare and justified.
The cultural shift is not easy, and there are trade-offs. Aggressive cost optimization can lead to friction if not handled carefully. For instance, revoking a license that an engineer uses only occasionally but relies on heavily during certain periods can cause frustration. A balanced approach with grace periods and easy reinstatement mitigates this risk. Additionally, focusing solely on cost can inadvertently discourage experimentation with new tools. Platform teams must strike a balance between fiscal responsibility and fostering innovation. The goal is not to starve teams of tools but to ensure that every dollar spent delivers value.
As engineering budgets come under increasing scrutiny, platform teams that can demonstrate responsible stewardship of tooling spend will earn credibility and influence. And the money saved can be reinvested in the tools that truly matter, creating a virtuous cycle of efficiency and innovation. However, it is important to acknowledge that not all waste can be eliminated, and some level of over-provisioning may be acceptable as a buffer for growth and experimentation. The key is to measure, act, and iterate, always keeping developer productivity at the center.